Friday, October 31, 2014

What Clarity Version Do I Have?

If you ever ask IBM Support or a consultant for help with Clarity, they will probably ask you, "What version of Clarity are you using?". This is meant to be a simple question, but for folks that don't know how to find the version, it can be a bit confusing. Here are some simple ways to identify which version of Clarity is installed on a given server.

Mouseover on the application title text


If you login to a Clarity application, you'll usually see some text describing the application on the top left of the screen. By default, this says, "Clarity 7". Often times, implementation teams will update this to a client's logo, or add the word 'Dev' to denote the development server. This helps users visually see which server they are using. By holding the mouse over this text, the exact version number of the Clarity product will be displayed, as shown above.

Properties of an Clarity DLL file


Sometimes, using the mouseover will not work, if the text is replaced by an image or logo. In that case, we can still find the Clarity version by looking at the properties of any Clarity.* DLL in the Clarity Systems\ClarityServer\Web\bin folder. 
  • Open Clarity Systems\ClarityServer\Web\bin
  • Right-click Clarity.ActivityTracker.dll and select properties (Any Clarity...DLL will work)
  • Select the Details tab
  • Look at the Product version property on the details tab

Tuesday, October 21, 2014

Versioning (Analysis Services) - How can I fix it?

Versioning is a tool in Clarity enabling users to copy data from a set of source dimension elements to a set of target dimension elements. The most common implementation of it gives users a selection for a source (scenario, year) combination and a target (scenario, year) combination. The tool itself looks clear and straightforward, but the complexity and risk is just below the surface. Below is an example of a more advanced configuration. In this example, a user selects a source (scenario, year, period, account) combination and a target (scenario, year, period) combination. This allows whole years to be copied, or individual periods. It also allows individual accounts, or a whole income statement. This also has options for which cube to version data and how many months should be copied. This screen is very flexible and configurable. This discussion will focus on SQL Server Analysis Services implementations. Versioning in Essbase is handled differently.

How Its Supposed To Work

This is how versioning should work for users.

  • User selects the source and target information
  • User clicks calculate
  • User can run reports and see the target data updated
Here are some of the common challenges that muddle this user experience
  • Users need to wait for a nightly process to run before seeing their versioned data
  • The webpage times out and users see errors
  • The webpage takes a long time to run and users are not sure if the process completed or not
  • The screen goes white while running and users are not sure if the process has crashed
  • Line item detail is not included when versioning
  • Capital or Human Resources detail is not included in versioning
Clarity Versioning Tool Screenshot

Versioning Algorithm

When implementing versioning for a client, here are the steps that need to be done to ensure a successful implementation and happy client.
  • Discuss the expectations with the client to uncover which parameters should be displayed
  • Update the Clarity Systems\ClarityServer\Web\Versioning\versioning.xml file to display those parameters and pass them to an underlying stored procedure (dbo.STP_VERSIONING)
  • Write a stored procedure to do the versioning, typically dbo.STP_VERSIONING with the following pseudocode. This could also be done using an SSIS package, but the pseudocode would be the same.
    • Check Parameters
      • Make sure source and target are different
      • Make sure target is not in an archive
      • Strip off any MDX style formatting
    • Clear Target
      • Delete data from the target combination in 
        • Each cube fact table
        • Each module table (HR/Capital)
        • Line Item Detail
    • Copy Data
      • Copy data from the source combination to the target combination in each of the above tables
    • Start a Job to Reprocess The Cube
      • At the end of the stored procedure, use something like the following to start a job that ONLY reprocesses the cube. This DOES NOT run the full nightly process. It only performs the ProcessFull process operation on the Analysis Services cube. If this is Essbase
        EXEC dbo.sp_start_job N'ProcessCube' ;
Following these steps, versioning will work fine and users will have a positive experience.

Versioning Options and Concerns

As the screen above shows, there are lots of options to consider. Here are some things to discuss with your implementation team to make sure you get all you can from this feature. 
  • What is the timing? How long will versioning take?
  • What about notifications? How do I know when it's done? ...failed?  ..emails?
  • What do I do if I see an error? How can I troubleshoot this? What are my next steps?
  • What grain of versioning do we want? OLAP? Capital? HR? LineItemDetail? Custom Tables?
  • Who should have access to this tool?
  • How can I make a backup first, in case I make a mistake?
  • How can I restore a backup, after I've made a mistake?
  • Should we use a stored procedure or a SSIS package?
  • Should I notify users before running this? ...who? ...how?
If you would like help with your current Clarity implementation, please feel free to reach out to us and we can help. (support@clearinsight.ca)


Thursday, May 22, 2014

Cognos TM1 10.2.2 is now available for download...and review

Cognos TM1 10.2.2

With the release of Cognos TM1 10.2.2, there are a number of updates users should try out. Here is a quick look at some of the ones I recommend checking out.

CAFE (Cognos Analysis For Excel) 

This tool has been around for a while, but has some noticeable improvements in this release. For anyone trying to provide a better user experience right in Excel, this helps provide that. Yes, we have Xcelerator to navigate views, but CAFE provides some additional column drilling now that wasn't available before.

Scorecarding

Scorecarding is now native functionality in TM1. With this 10.2.2 release, they have further improved the experience by being able to convert a planning cube into a metrics cube... with one click!  Previously, we would need to create a separate metrics cube with the KPIs embedded. Now, the tool can generate the metrics cube from any planning cube...making scorecarding faster and easier.

Data Flow Diagrams in Performance Modeler

Performance Modeler is a good tool for designing cubes, links and processes. One challenge has always been graphically displaying the links between all models in an application. The folks at IBM have solved this one now. In Performance Modeler, we can now navigate a visual display showing all the cubes in our model, as well as the links (rules and TIs) between them. This is still not as powerful as the analysis provided by something like QubeDocs, but it will really help folks learn and maintain new models they encounter.

Download IBM Cognos TM1 10.2.2

IBM Cognos TM1 10.2.2 Fix List

Tuesday, May 13, 2014

Free Youtube Course on Building IBM Clarity7 Reports

  Building reports in ClarityStudio can be a bit challenging without some guidance. To help new folks along, we have developed a series of Youtube videos to walk you through the process of developing a complex report. This particular report that we build together is a validation report to compare two cubes. This is a very important part of any testing phase of a project. This gives us the visibility into the system to question any number in the cube, and reconcile it back to a source system. Instead of having to ask a DBA to verify numbers, the Finance team can verify numbers anytime they want ensuring they are comfortable and confident in the numbers they report.

  Starting from scratch, we talk about all these topics while building this validation report:

  • Layout of a report
  • Dimensions
  • Connecting to datasources
  • OLAP Member Lists - Selecting dimension members
  • OLAP Maps - Setting up result sets for display on the Excel grid
  • Page Options
  • Calculating Variances
  • Traffic Lighting
  • Linked Documents
  • Cascading
  • Block Formatting
  • Zooming (Zoom In / Zoom Out)
  • Security Setup
  • Audit Trail
  • Archiving
  • Dashboards in Visualizer
   A Youtube playlist has been setup to walk you through the sequence of videos. The idea is that you can follow along and build the same report in your own environment. It uses the demo cube that should be installed with every Clarity implementation, so you can use the exact same setup when you do it too.

   Here is a link to the Youtube playlist. Please send us your comments to info@clearinsight.ca or @clearinsightfpm on what other types of videos you would like to see in this new training series.


Enjoy,

Bob

Tuesday, February 11, 2014

Archiving - How to improve performance by archiving old (Scenario,Year) combinations - IBM Clarity

Youtube video on this topic - http://youtu.be/zLjFeV2RCyI

Any database application should be able to deal with data growth. As an application is used, data is created and evolves. With a corporate performance management tool, data can nicely sliced by a (Scenario, Year) combination. For example (Actual, 2004) would be the actual transactions that happened in 2004. (Budget, 2006) would be the approved budget for 2006). If a system has been in use for 5 years and each year is focused on building only a 1-year plan, 80% of the data is static. Many administrators do not know that, in most cases, all active data is reprocessed each night. Even though the last 4 years of data is not changing, those rows need to be loaded, checked and recalculated. The archiving process moves this data into separate tables that do not get reprocessed each night. That data is still available in the cube, but it does not eat up CPU cycles each night. It also does not need to be backed up each night. By keeping it in a separate database, daily backup file sizes can remain constant for as long as the application is in use. Rather than having backups of 60GB or more, backups should rarely be larger than 20GB.

High Level Steps for Archiving


  1. Figure out which (Scenario, Year) combinations have data in the system right now
  2. Decide which (Scenario, Year) combinations should be deleted, archived or stay active
  3. Create a new database for archiving
  4. Setup archive copies of only the necessary fact tables in this new archive database
  5. Write a process to move data to or from the active and archive tables
  6. Run the process to archive out each (Scenario, Year) combination that should be archived
  7. Add a new cube partition for the archive table


Friday, December 20, 2013

Writing Advanced Snippets When Building Templates

Both Clarity and TM1 support the MultiDimension eXpression (MDX) query language through snippets. Snippets are single MDX phrases that can be evaluated as part of an MDX query. At first glance, it can seem intimidating, but starting with a few key functions, it's easier to start using it to put together advanced snippets.

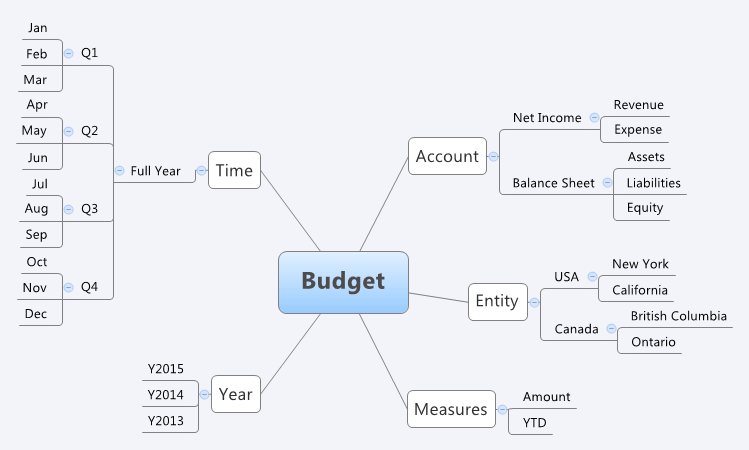
Let's go through an example. Let's say we have the following cube.

Our dimensions are:
  • Year
  • Time
  • Entity
  • Account
  • Measures
When building a template in ClarityStudio, I can select Member, Children, IChildren, Descendants, IDescendants and BottomLevelDescendants by right-clicking on an element in a dimension hierarchy. Let's start by explaining how these ones map to MDX expressions, using the Full Year member from the Time dimension.

Clarity Function
Description
MDX Function
MDX Snippet
Members Included
Member
Show just the one element I picked from the list
None
[Time].[Full Year]
Full Year
Children
Show just the elements directly below the one I selected
[Time].[Full Year].Children
Q1, Q2, Q3, Q4
IChildren
Show the elements directly below the one I selected, plus the one I selected
{[Time].[Full Year].Children, [Time].[Full Year]}
Q1, Q2, Q3, Q4, Full Year
Descendants
Show all elements anywhere below the one I selected, regardless of distance
Descendants(
[Time].[Full Year])
Q1, Q2, Q3, Q4, Jan, Feb, Mar, Apr, May, Jun, Jul, Aug, Sep, Oct, Nov, Dec
IDescendants
Show all elements anywhere below the one I selected, regardless of distance, including the one I selected
{Descendants(
[Time].[Full Year]) , [Time].[Full Year]}
Q1, Q2, Q3, Q4, Jan, Feb, Mar, Apr, May, Jun, Jul, Aug, Sep, Oct, Nov, Dec, Full Year
Bottom Level Descendants
Show only the elements that have no children below the one I selected. These are also known as leaf elements.
Descendants(
[Time].[Full Year]
,,LEAVES)
Jan, Feb, Mar, Apr, May, Jun, Jul, Aug, Sep, Oct, Nov, Dec

Now that you've seen how the ones you already know map to MDX expressions, you can play with other MDX expressions to help get exactly the sets you want for your template.


Thursday, November 28, 2013

Automated Regression Testing for Clarity and TM1

  One of the best things about IBM Clarity7 and IBM Cognos TM1 is their flexibility and empowerment to build templates fast. This quick development time introduces a natural challenge... did we break something? Here are some examples of simple things that break old code.

Common Challenges That Break Old Code

  • Adding new children under a node that was previously a leaf
  • Changing network share names
  • Changing server names
  • Changing paths (of anything)
  • Renaming (of anything)
  • Changing scope statements
  • Changing stored procedure calculations 

Change is Good

  One solution is to never change the system. That is equivalent to shelving the product and going back to Excel. Given that option is out the door, we have to assume change WILL happen. In fact, we want to encourage change. We want the system to be the most valuable representation of the business for decision makers.

Trust

  The system should be the trusted, single source of the truth. Numbers must be consistent, reliable, punctual and accessible. Once trust in the numbers is broken, it is hard to rebuild that trust. Fear of losing this trust hinders many organizations from making any changes at all. This latency pushes users to go back to Excel and find other ways to get the job done under time pressure. Instead of helping information workers, the system sits idle. We need a way to keep the trust of users, while still improving and evolving the system to keep up with business realities. This solution must also be transparent. If anyone wishes to question the numbers, they should be able to do so. This helps them build confidence that they understand exactly how numbers flow and calculate across the system. If they are concerned something is wrong, they are empowered to investigate and identify issues themselves, without reliance on IT.

Excel is the Common Denominator

  Whether files are created manually, with TM1, Clarity or something else, Excel is the common denominator. Excel is the defacto business standard for analysis. Once we accept this, we can steer away from proprietary comparisons of weird format types. To build trust, we need to be transparent to users down to the Excel level.

Generating Excel Files

  Any reporting tool can automatically spit out Excel files. There is always a tool to export data to Excel. There is usually a tool to automate generation of set of Excel files. Even if this isn't available through a nice tool, there are lots of VBA code snippets to do the trick. Here is one on bulk reporting in TM1 that is quite good. So let's assume we now automatically generate 50 excel files with the click of a button.

Comparison

  After a full round of testing, we can take a copy of these generated files and call them our Gold Standard. From that point on, each night we generate the same set of reports and compare them to the Gold Standard version. If there is any difference between the files, we get an alert. This simple alert allows us to proactively notify users about a data challenge while we investigate. Instead of the users telling the team where the errors are, the team can tell users where the errors are. At first, this may sound like a bad thing, but it's not. Users get transparency into the deep level of regression testing that happens on a nightly basis. Over time, this transparency and notification build trust in the system. Users will be more comfortable using the data because they know we are watching our data quality very carefully. Users can invest more time doing analysis, rather than testing and data validation.

High Level Design

  Here is a quick diagram of the high level design for this process. First we build a list of the pairs of Excel files we want to compare each night. This could be as simple as comparing one directory to another. For each pair, we compare the Gold Standard Version to the one generated last night and capture the results. When reading results, if we encounter differences, we can decide what type of action to take or notification to send.


Next Steps

So, how do we build this? Firstly, you can ask us for help (http://www.clearinsight.ca @clearinsightfpm or info@clearinsight.ca)  or follow some of these steps.
  • Build or buy an Excel comparison tool. I recommend Diff Doc.
  • Build or buy a method to automatically generate sets of excel files periodically from your reporting tool. I recommend using the native scheduling tool in your reporting tool if you have one, or some VBA code for bulk reporting.
  • Build a process to compare these files and make appropriate action or send appropriate notification. I recommend using an SSIS package. Here is a link on how to start.